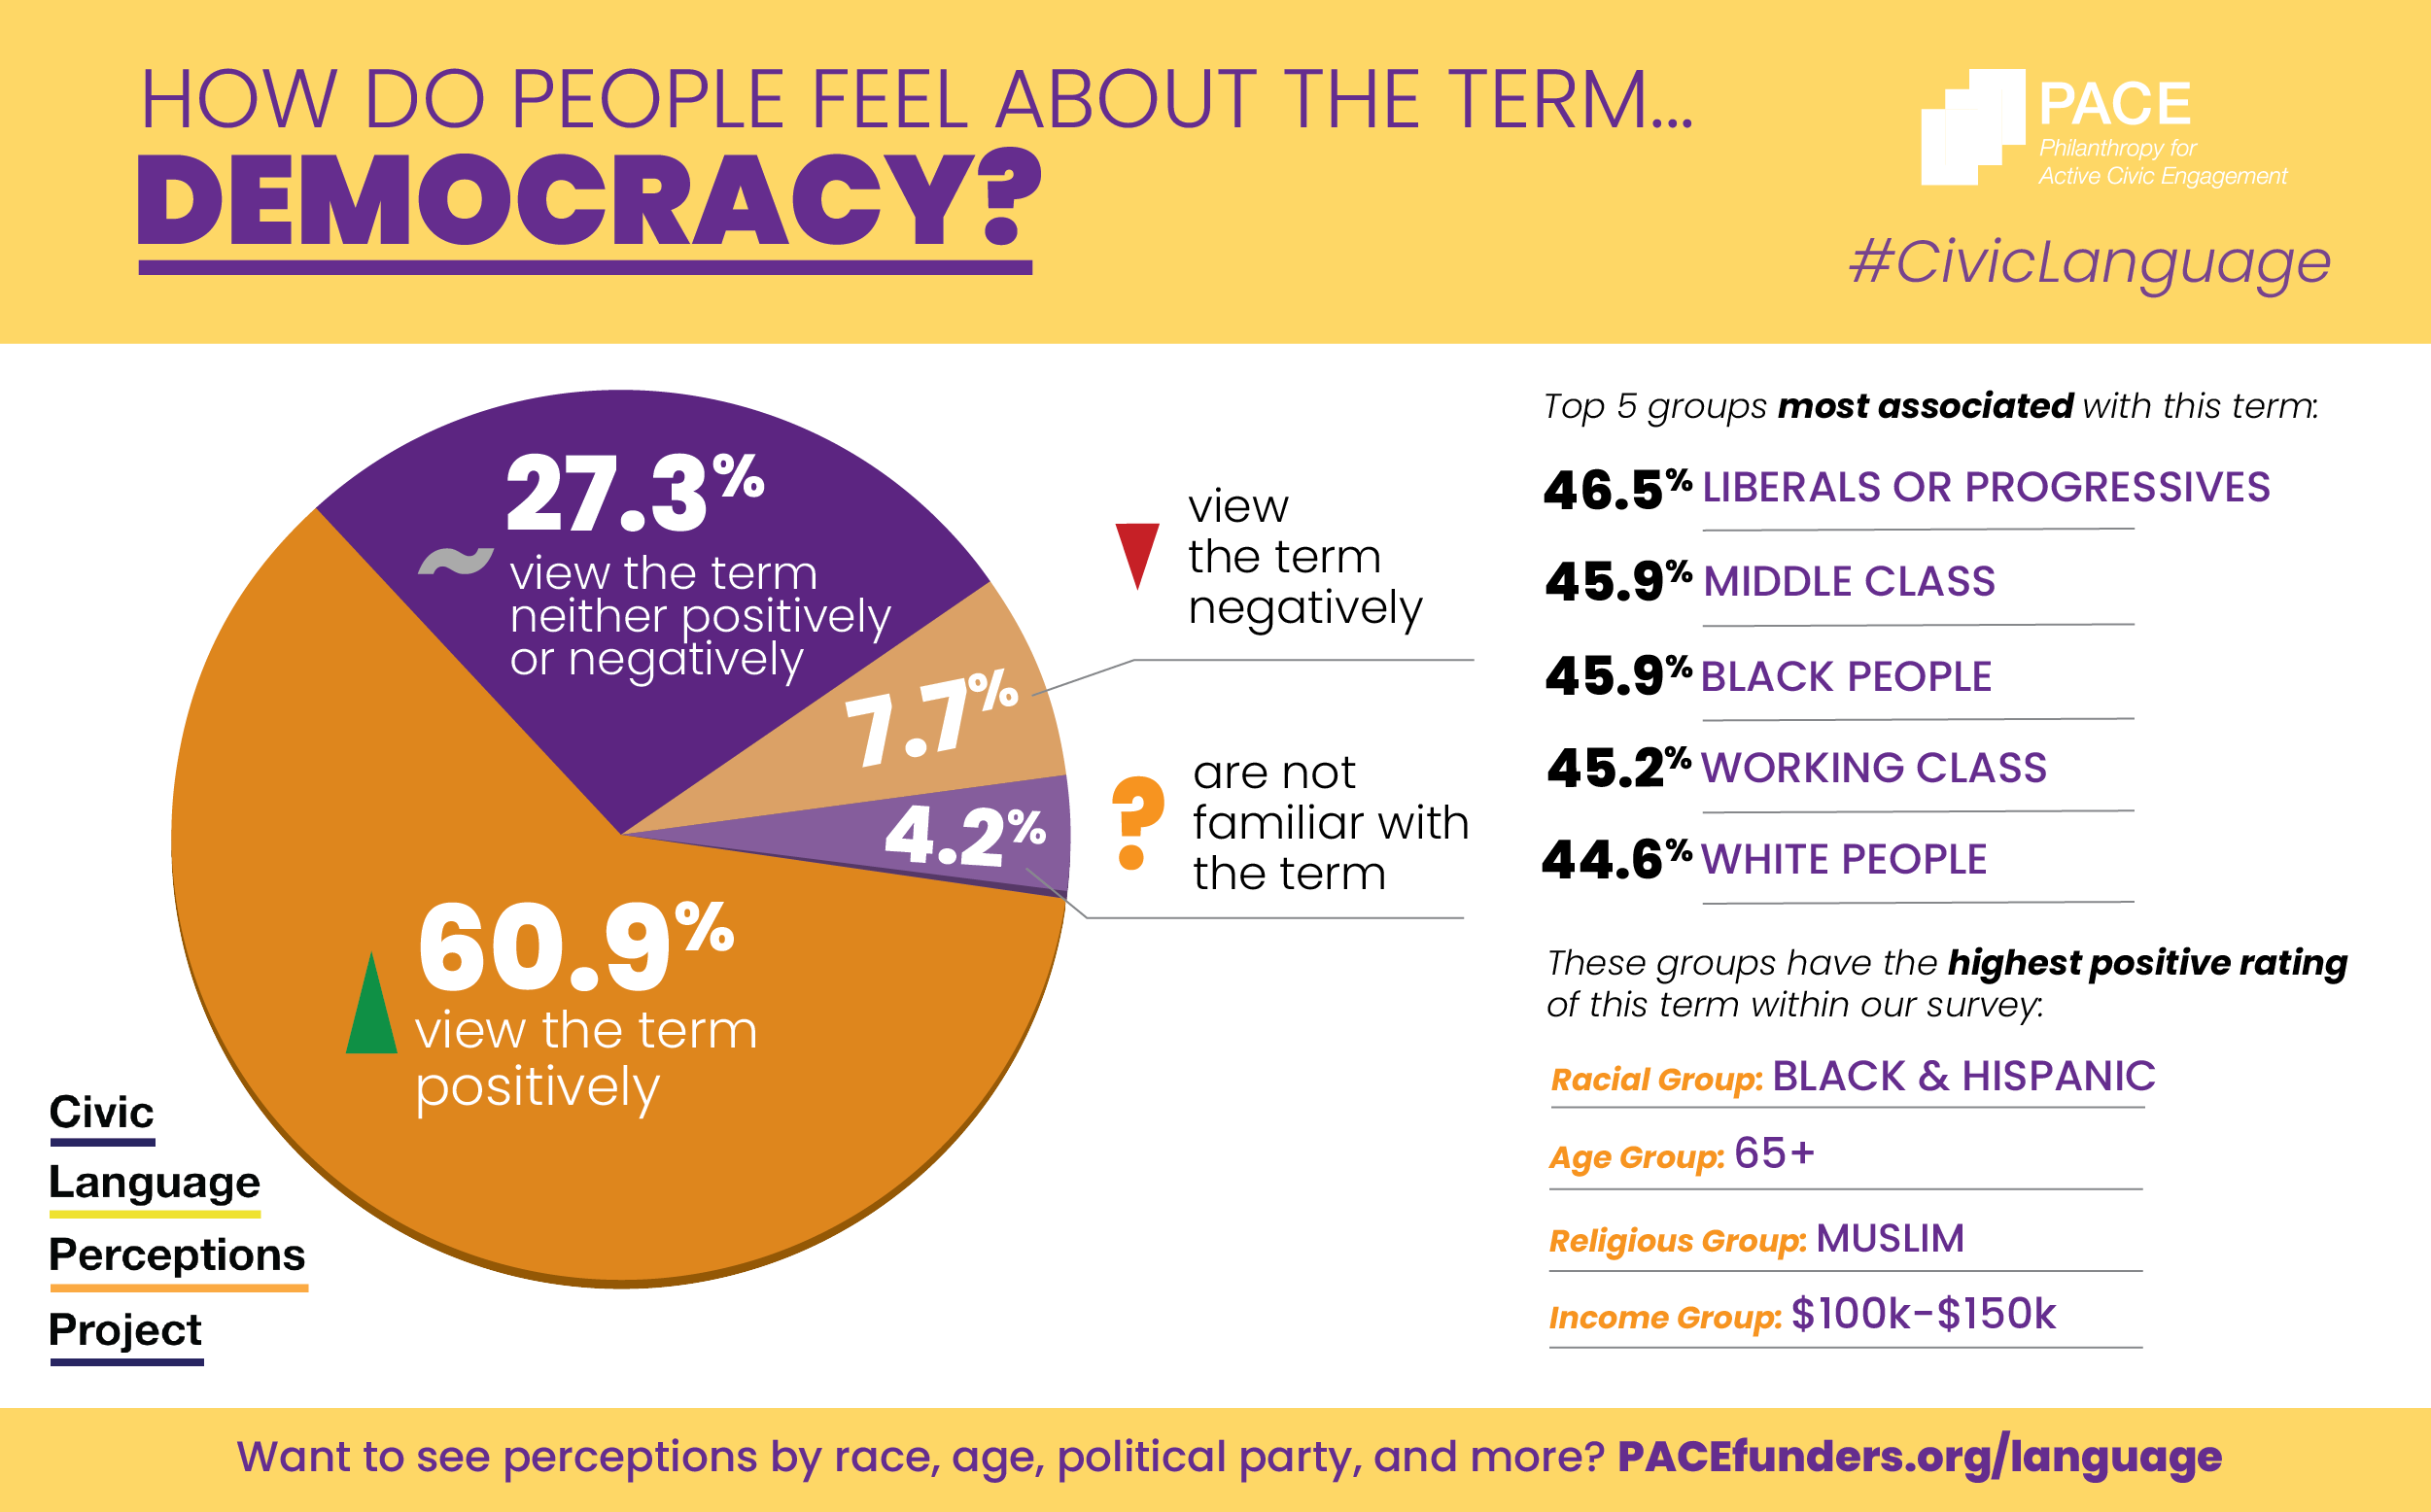
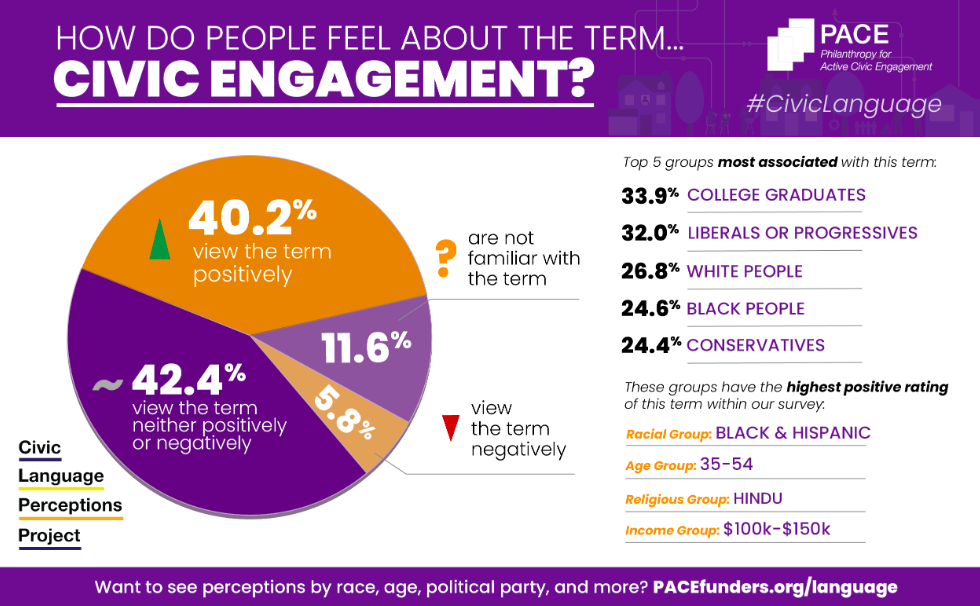
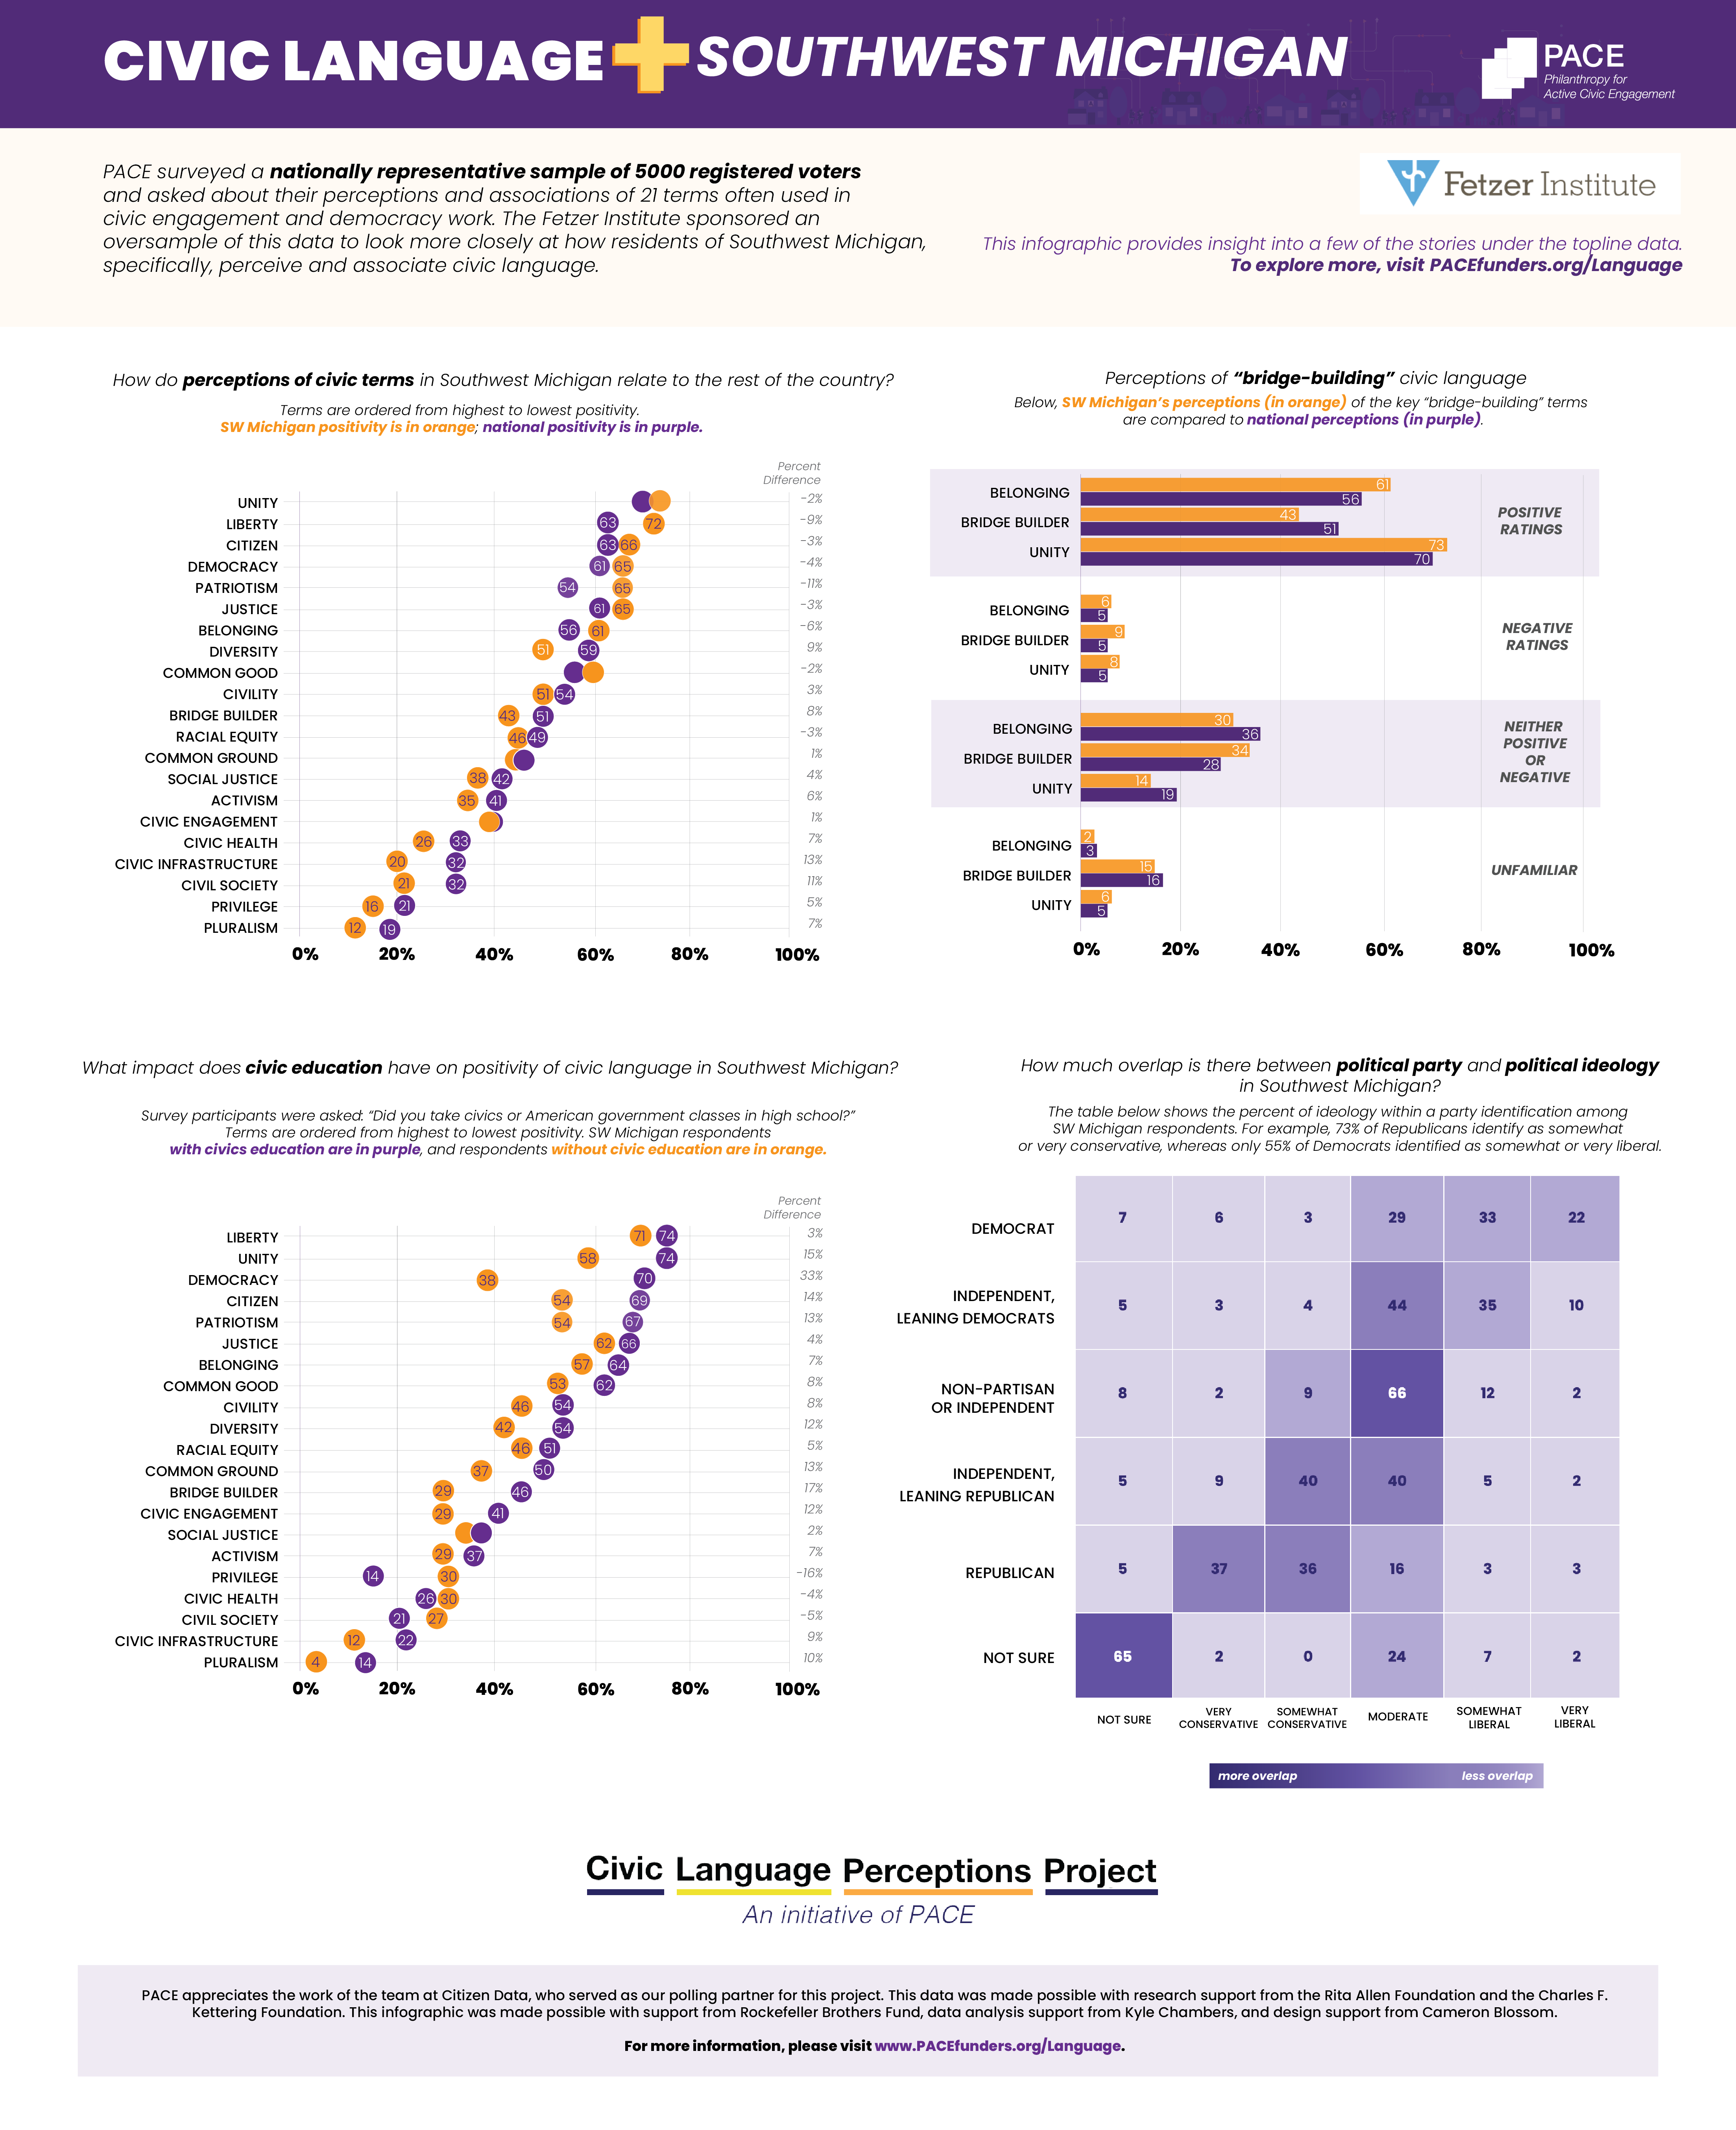
PACE released the data from its Civic Language Perceptions Project, which seeks to understand people’s perceptions of the language associated with civic engagement and democracy work. In partnership with Citizen Data, PACE fielded a nationally representative survey of 5,000 registered voters between November 21-28, 2021. The result is 16,000 pages of data, which offers an incredibly rich dataset and endless opportunities to explore Americans’ relationship to civic language.
The data is accessible via an interactive dashboard. In addition, we know there is a lot of interest in this data from specific angles, so to make the data even more accessible, PACE is developing and releasing a series of infographics. We encourage you to share them with colleagues, partners, and online. For better viewing, click on the image and scroll through the gallery.
NOTE: Infographics reflect the data as collected in our dataset, but not all groups have comparable sample sizes, and margin of error may vary. All data is available in the dashboard for reference and transparency. Also, no community or group is a monolith, so it is important to view these data as one input into a larger meaning-making process, and not a definitive or authoritative conclusion in itself.
View Infographics by Type

Acknowledgements
PACE appreciates the work of the entire team at Citizen Data, our polling partner, for bringing this process to life. The first phase of the 2022 CLPP is made possible with research support from the Rita Allen Foundation and the Charles F. Kettering Foundation. These infographics, in particular, are made possible with support from Rockefeller Brothers Fund and design support from Cameron Blossom.